✨ Industry Leading Data Analytics
Unlock Insights,
Elevate Your Data
To New Levels
Empowering forward-thinking businesses with sophisticated custom analytics dashboards and AI-powered insights that transform raw data into strategic assets. Our comprehensive solutions deliver actionable intelligence for smarter, faster, and more confident decision-making across your entire organization.
Interactive Dashboards
Real-time visualization with fully customizable interfaces
Advanced Analytics
Predictive models and trend analysis powered by machine learning
Enterprise Integration
Seamless connection with your existing data sources and systems
WHO WE ARE
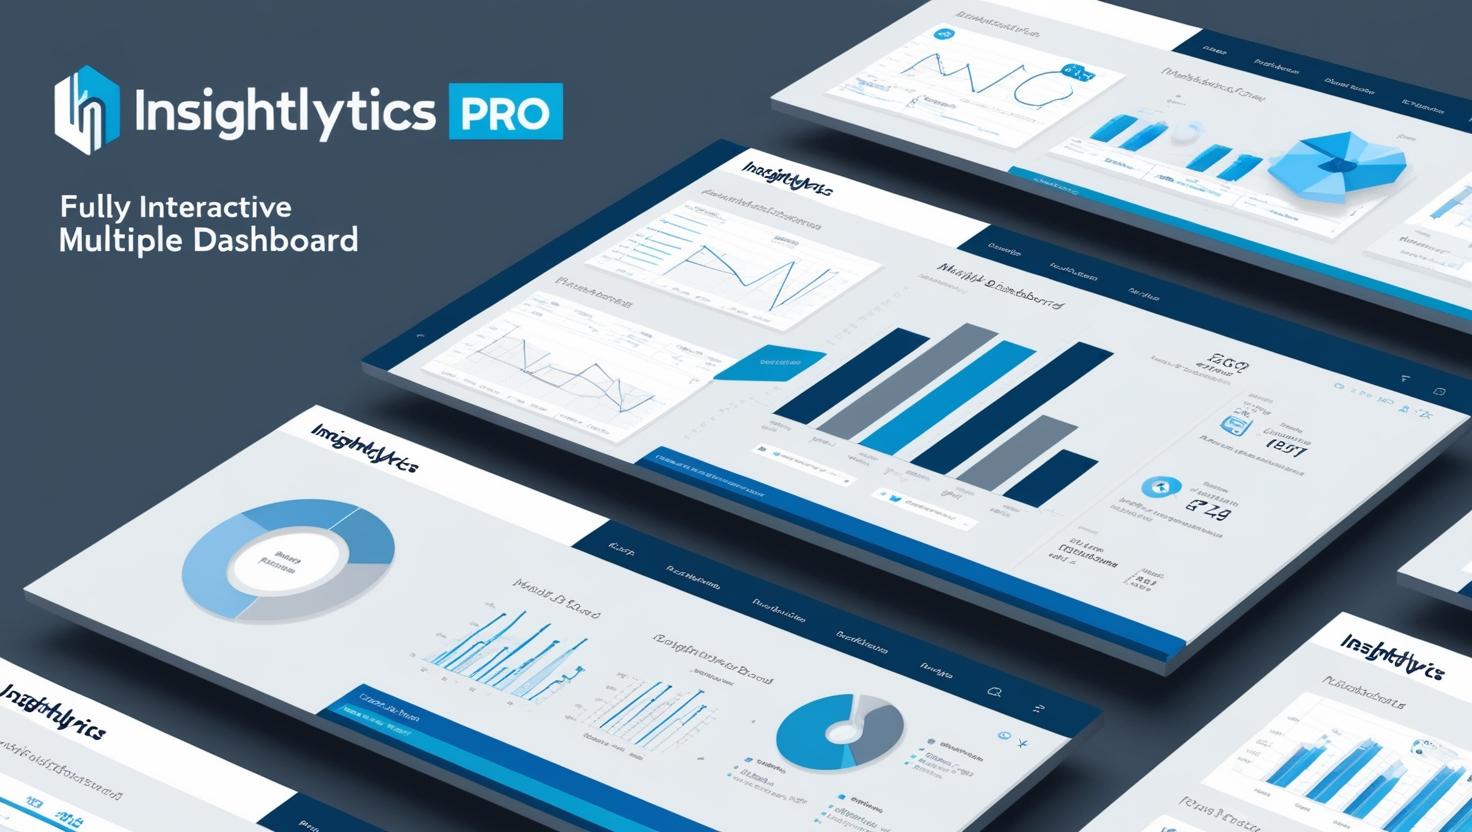
About Insightlytics Pro
Insightlytics Pro is a premier data analytics consultancy with deep expertise in developing customized dashboards using cutting-edge platforms like Power BI, Looker Studio, Tableau, and Excel. Our comprehensive approach transforms complicated data into clear, actionable insights that empower businesses to make confident, data-driven decisions that drive growth and innovation.
With over a decade of specialized experience in advanced data analytics, our team of certified experts has successfully partnered with businesses across diverse industries to transform their raw data into powerful strategic assets. We pride ourselves on combining sophisticated technical expertise with deep business acumen to deliver tailored solutions that directly impact your operational efficiency, customer experience, and bottom line.
At Insightlytics Pro, we don’t just analyze data—we tell your company’s story through numbers, revealing hidden patterns and opportunities that traditional analysis might miss. Our collaborative approach ensures that every dashboard and report we create aligns perfectly with your specific business objectives and user needs.
95%
Client retention rate due to our exceptional service quality
500+
Custom dashboards delivered to clients worldwide
Our Mission
To transform complex data into clear, actionable insights that drive business growth and innovation through cutting-edge analytics solutions.
Our Vision
To be the global leader in democratizing data analytics, making powerful insights accessible to businesses of all sizes.
Our Values
Our Capabilities
Powerful Features
Our comprehensive suite of features designed to transform your data into
actionable business intelligence.
Interactive Dashboards
Dynamic, real-time data visualization with highly customizable elements that adapt to your specific business needs. Our dashboards feature drag-and-drop interfaces, allowing non-technical users to explore data with ease.
Custom Reporting
Tailored, professional-grade data reports with compelling visual storytelling that translates complex information into clear narratives. Schedule automated reports or generate them on-demand in multiple formats.
Data Security
Enterprise-grade security standards with end-to-end encryption, role-based access controls, and compliance with international data protection regulations. Your sensitive information is always protected.
AI-Powered Insights
Dynamic, real-time data visualization with highly customizable elements that adapt to your specific business needs. Our dashboards feature drag-and-drop interfaces, allowing non-technical users to explore data with ease.
Advanced Data Integration
Seamlessly connect and unify multiple data sources through our robust ETL processes. Our platform supports integration with databases, cloud services, CRMs, ERPs, and hundreds of other business applications.
Collaboration Tools
Powerful real-time sharing and collaborative features that enable team members to work together on dashboards, add comments, annotations, and insights. Perfect for distributed teams and cross-departmental collaboration.
300+ Pre-built Templates
Extensive library of industry-specific dashboard templates designed by data visualization experts. Each template is fully customizable and follows best practices for data presentation and user experience.
Predictive Modeling
Sophisticated AI algorithms that analyze historical data to forecast future trends with remarkable accuracy. Build scenarios, test hypotheses, and make proactive decisions based on data-driven predictions.
Automated Alerts
Intelligent notification system that monitors your data 24/7 and provides real-time alerts on significant anomalies and critical insights. Customize thresholds and delivery methods for each metric that matters to your business.
Expert Solutions
Our Services
Comprehensive data analytics and dashboard solutions tailored to your business needs.
Data Analytics
- Identify key trends and KPIs using real-time data.
- Analyze customer behavior and product performance.
- Enable data-driven marketing and sales strategies.
- Generate automated reports for leadership teams.
- Use segmentation for personalized business insights.
Data Engineering
- Design and manage ETL/ELT pipelines.
- Integrate data from multiple sources (APIs, databases, CRMs).
- Implement data warehousing solutions (BigQuery, Snowflake).
- Ensure data quality, availability, and consistency.
- Automate data workflows using scripts and tools.
Data Visualization
- Create interactive reports using Power BI, Tableau, Looker Studio.
- Design executive dashboards for quick overviews.
- Enable department-wise visualization (Sales, HR, Finance, etc.).
- Use dynamic filters and drill-downs for deeper insights.
- Apply storytelling principles to improve data understanding.
Data Science
- Build predictive models using historical data.
- Apply machine learning for classification, regression, clustering.
- Use time-series forecasting for business planning.
- Conduct sentiment analysis and NLP for social/text data.
- Validate models with cross-validation and performance metrics.
Big Data
- Process large volumes of structured and unstructured data.
- Use tools like Hadoop, Spark, and Kafka for big data pipelines.
- Enable real-time streaming analytics.
- Optimize performance using distributed computing.
- Store and query petabytes of data efficiently.
Data Modeling
- Create conceptual, logical, and physical data models.
- Normalize databases to reduce redundancy.
- Define relationships, hierarchies, and dependencies.
- Use ER diagrams and schema design best practices.
- Optimize models for performance and scalability.
Data Governance
- Define data policies, roles, and responsibilities.
- Monitor data access and user permissions.
- Implement data quality checks and version control.
- Ensure compliance with GDPR, HIPAA, etc.
- Establish audit trails and data lineage tracking.
Dashboard Development
- Develop custom dashboards for different business functions.
- Include KPIs, charts, heatmaps, and gauges.
- Enable real-time updates and alerts.
- Provide multi-user access with role-based views.
- Optimize dashboards for web and mobile devices.
AI Consulting
- Identify key trends and KPIs using real-time data.
- Analyze customer behavior and product performance.
- Enable data-driven marketing and sales strategies.
- Generate automated reports for leadership teams.
- Use segmentation for personalized business insights.
Data Engineering
- Design and manage ETL/ELT pipelines.
- Integrate data from multiple sources (APIs, databases, CRMs).
- Implement data warehousing solutions (BigQuery, Snowflake).
- Ensure data quality, availability, and consistency.
- Automate data workflows using scripts and tools.
Data Visualization
- Create interactive reports using Power BI, Tableau, Looker Studio.
- Design executive dashboards for quick overviews.
- Enable department-wise visualization (Sales, HR, Finance, etc.).
- Use dynamic filters and drill-downs for deeper insights.
- Apply storytelling principles to improve data understanding.
Data Science
- Build predictive models using historical data.
- Apply machine learning for classification, regression, clustering.
- Use time-series forecasting for business planning.
- Conduct sentiment analysis and NLP for social/text data.
- Validate models with cross-validation and performance metrics.
Big Data
- Process large volumes of structured and unstructured data.
- Use tools like Hadoop, Spark, and Kafka for big data pipelines.
- Enable real-time streaming analytics.
- Optimize performance using distributed computing.
- Store and query petabytes of data efficiently.
Data Modeling
- Create conceptual, logical, and physical data models.
- Normalize databases to reduce redundancy.
- Define relationships, hierarchies, and dependencies.
- Use ER diagrams and schema design best practices.
- Optimize models for performance and scalability.
Data Governance
- Define data policies, roles, and responsibilities.
- Monitor data access and user permissions.
- Implement data quality checks and version control.
- Ensure compliance with GDPR, HIPAA, etc.
- Establish audit trails and data lineage tracking.
Dashboard Development
- Develop custom dashboards for different business functions.
- Include KPIs, charts, heatmaps, and gauges.
- Enable real-time updates and alerts.
- Provide multi-user access with role-based views.
- Optimize dashboards for web and mobile devices.
Industries We Serve
We provide highly specialized, domain-specific analytics solutions across a diverse range of industries, combining deep technical expertise with industry-specific knowledge to deliver tailored insights that address the unique challenges and opportunities in each sector. Our team includes data scientists and analysts with extensive experience in multiple verticals.
E-commerce & Retail
Gaming
Healthcare & MedTech
SaaS & B2B Tech
FinTech & Digital Banking
Logistics & Supply Chain
Ready to Transform Your Data Analytics?
Contact us today to discuss how our services can help your business make
better data-driven decisions.
Specialized Services
Solutions That Drive Results
We offer sophisticated, proven analytics solutions specifically engineered for diverse business needs and industries. Our data experts combine deep domain knowledge with cutting-edge analytics technology to help you extract meaningful, actionable insights from your data, enabling informed strategic decisions that drive measurable business growth and competitive advantage.
Marketing Analytics
Optimize your marketing campaigns with data-driven insights on performance, ROI, and customer engagement. Our marketing analytics solutions help you identify high-performing campaigns to scale and optimize your marketing budget for maximum return.
Learn More: HomeWeb Analytics
In-depth analysis of website traffic, user behavior, and conversion funnels. Identify high-performing content and optimize the user journey for better conversion. Our web analytics solutions help you improve online performance and drive better results.
Learn More: HomeProduct Analytics
Track user behavior, feature adoption, and product performance to drive improved experiences and retention. Understand how customers interact with your products and features to make data-driven decisions that enhance satisfaction and drive growth.
Learn More: HomeCustom Dashboards
Interactive, real-time visualization of your most important metrics in beautifully designed dashboards. Fully customized and based on your unique business needs, our dashboards are built to your specifications with enterprise-grade security
Learn More: HomeBusiness Intelligence
Comprehensive analytics solutions that provide a complete view of your organization’s performance and opportunities. See all of your finances in one place: Total Revenue Growth Rate, Gross Profit Margin, Net Profit Margin, with powerful visualization tools.
Learn More: HomeA/B Testing
Data-driven experimentation framework to optimize experiences, messaging, and conversion rates.Visualize experiment results with statistical significance and confidence intervals. Make data-driven decisions on product features, UI changes, and marketing messages.
Learn More: HomeThis is just a placeholder to help you visualize how the content is displayed in the tabs. Feel free to edit this with your actual content.
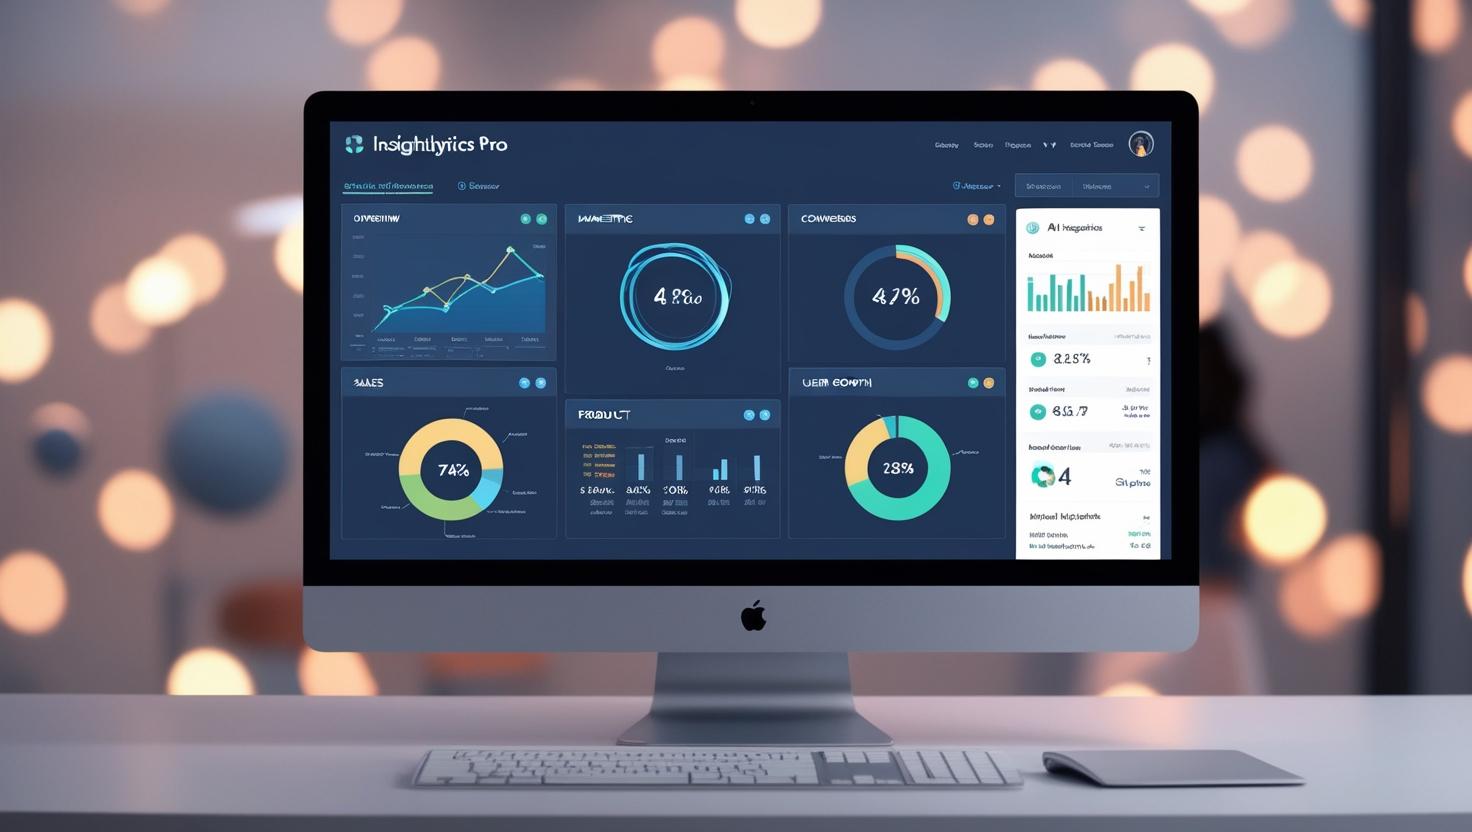
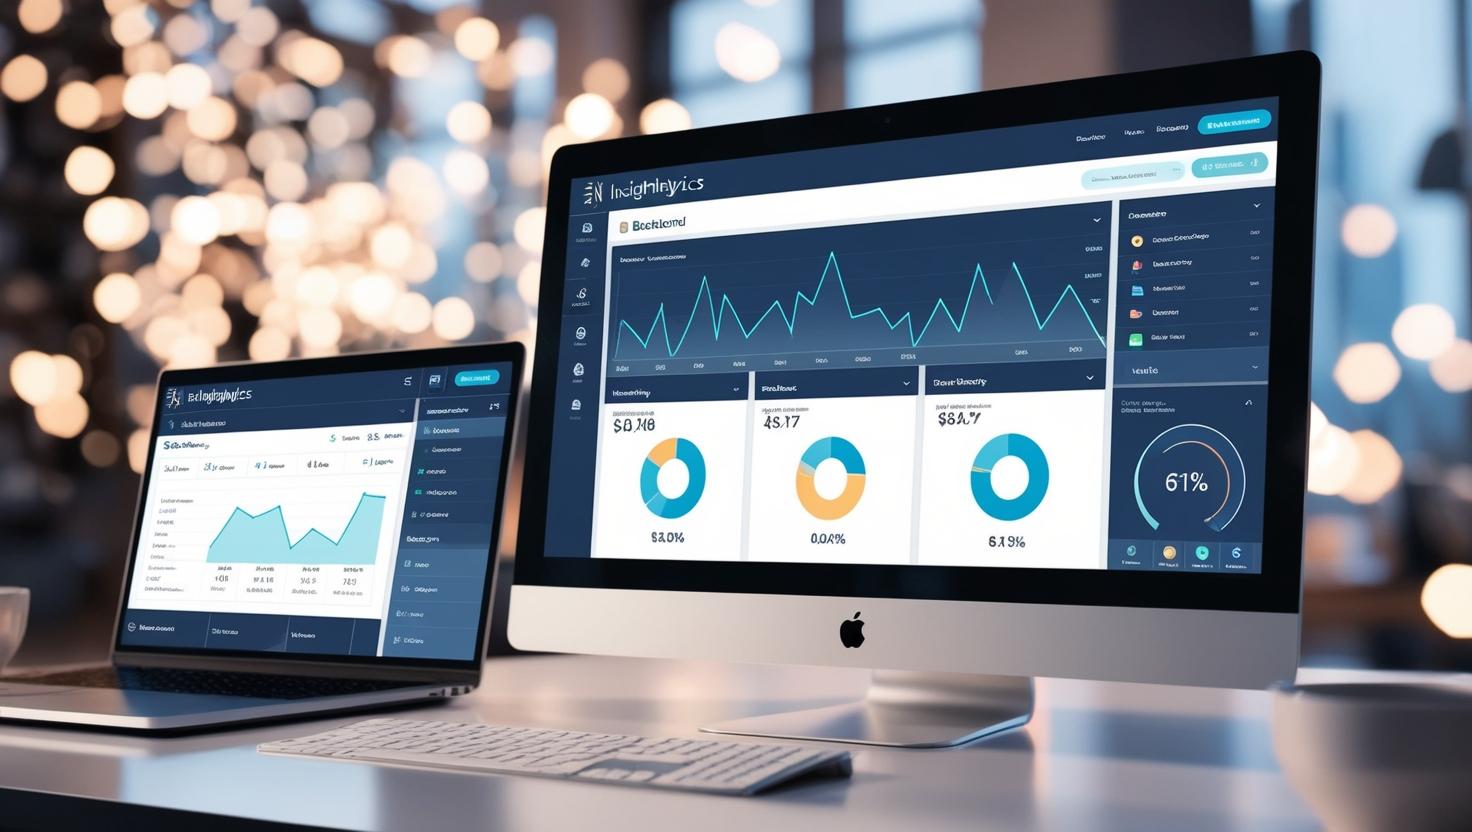
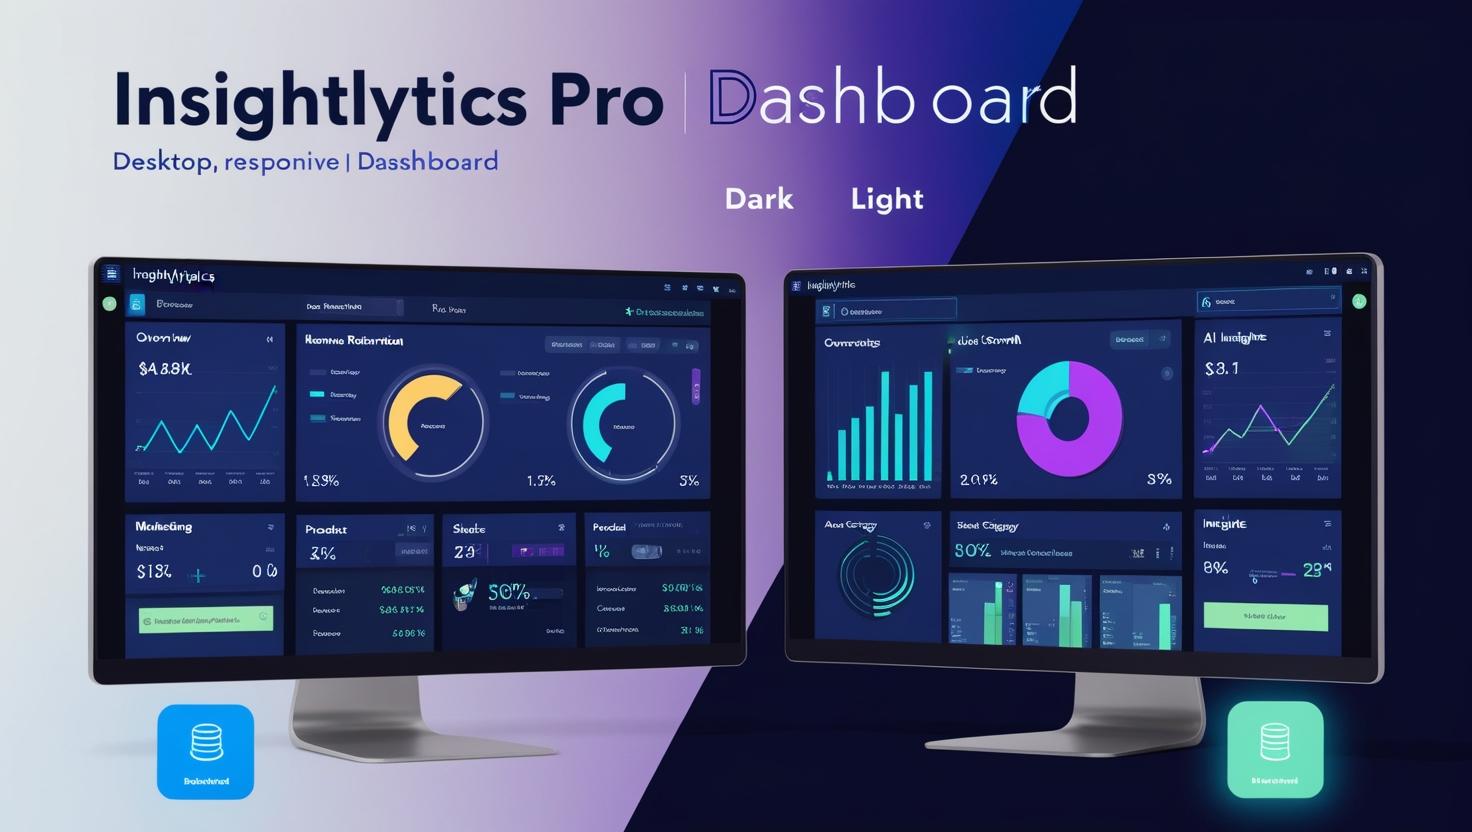
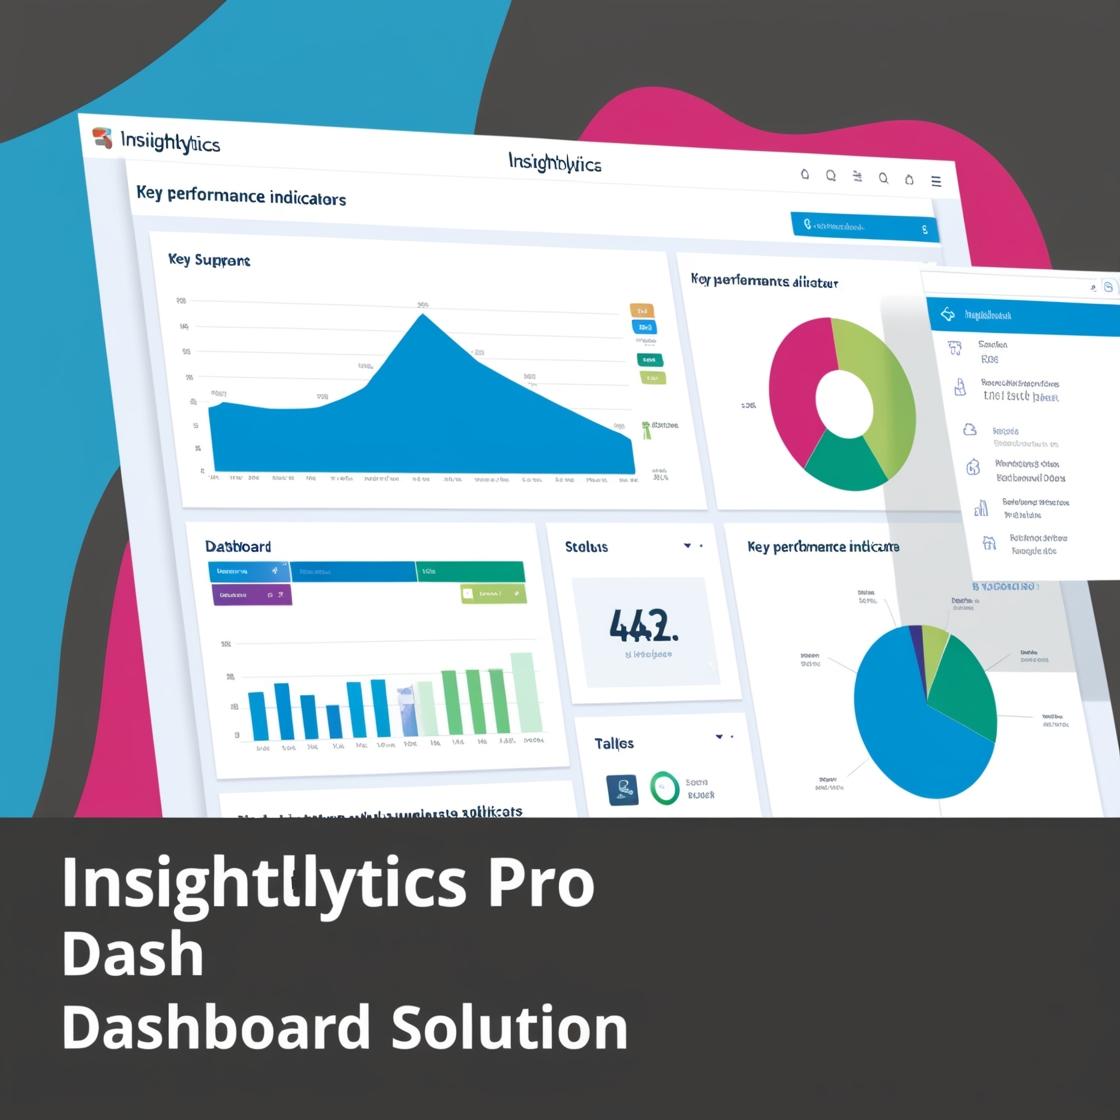
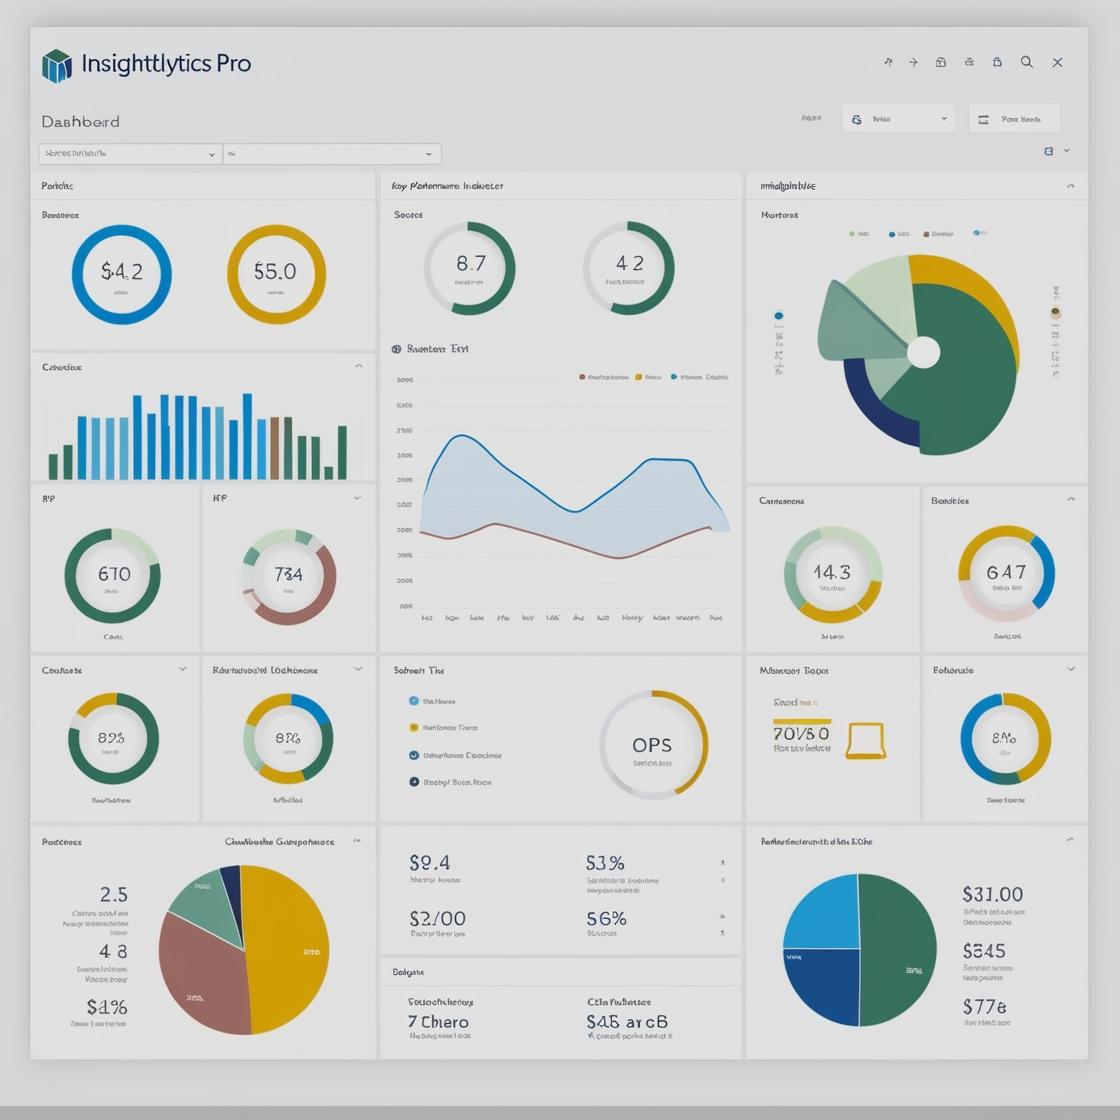
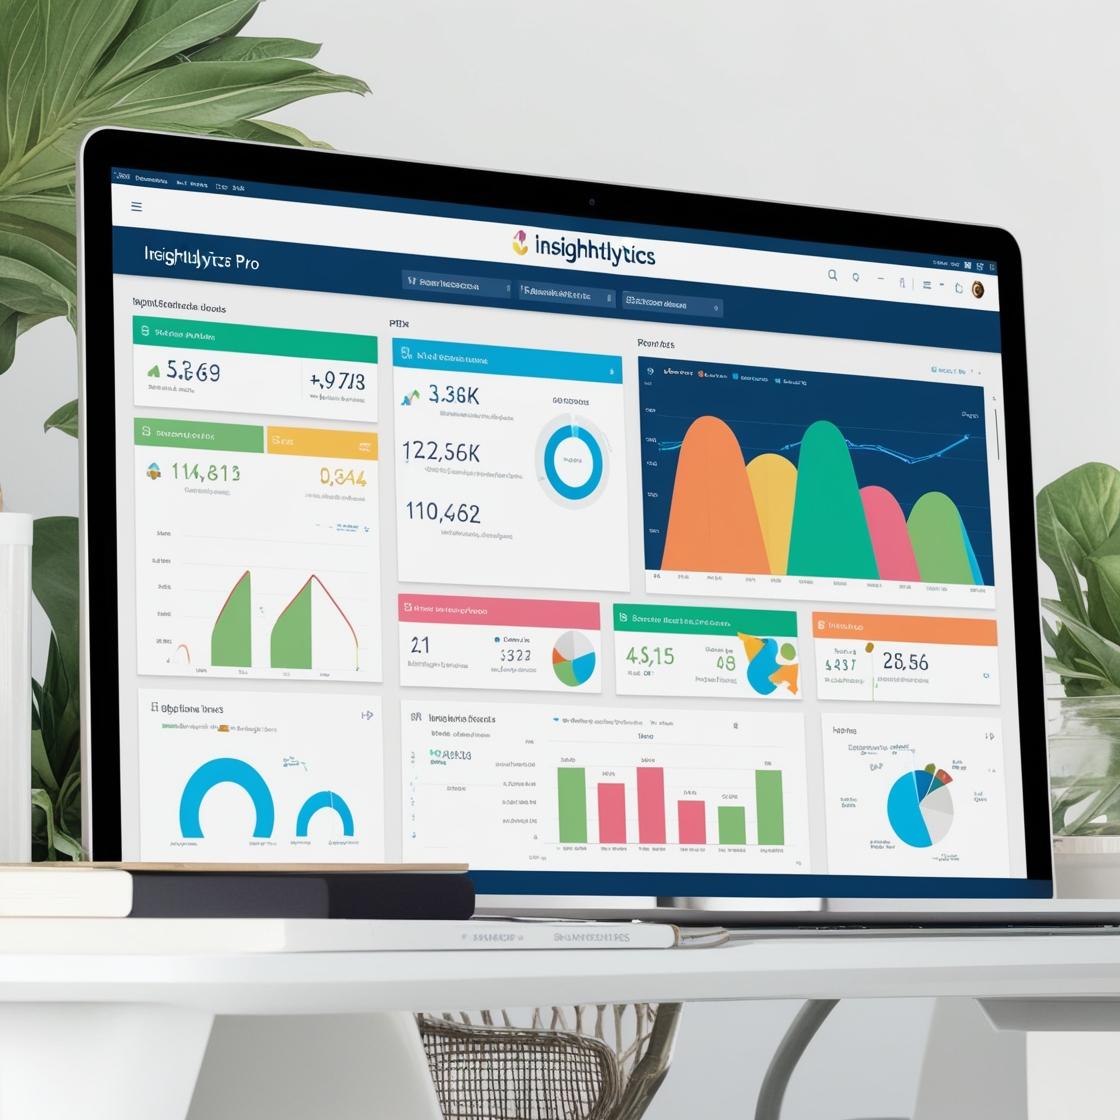
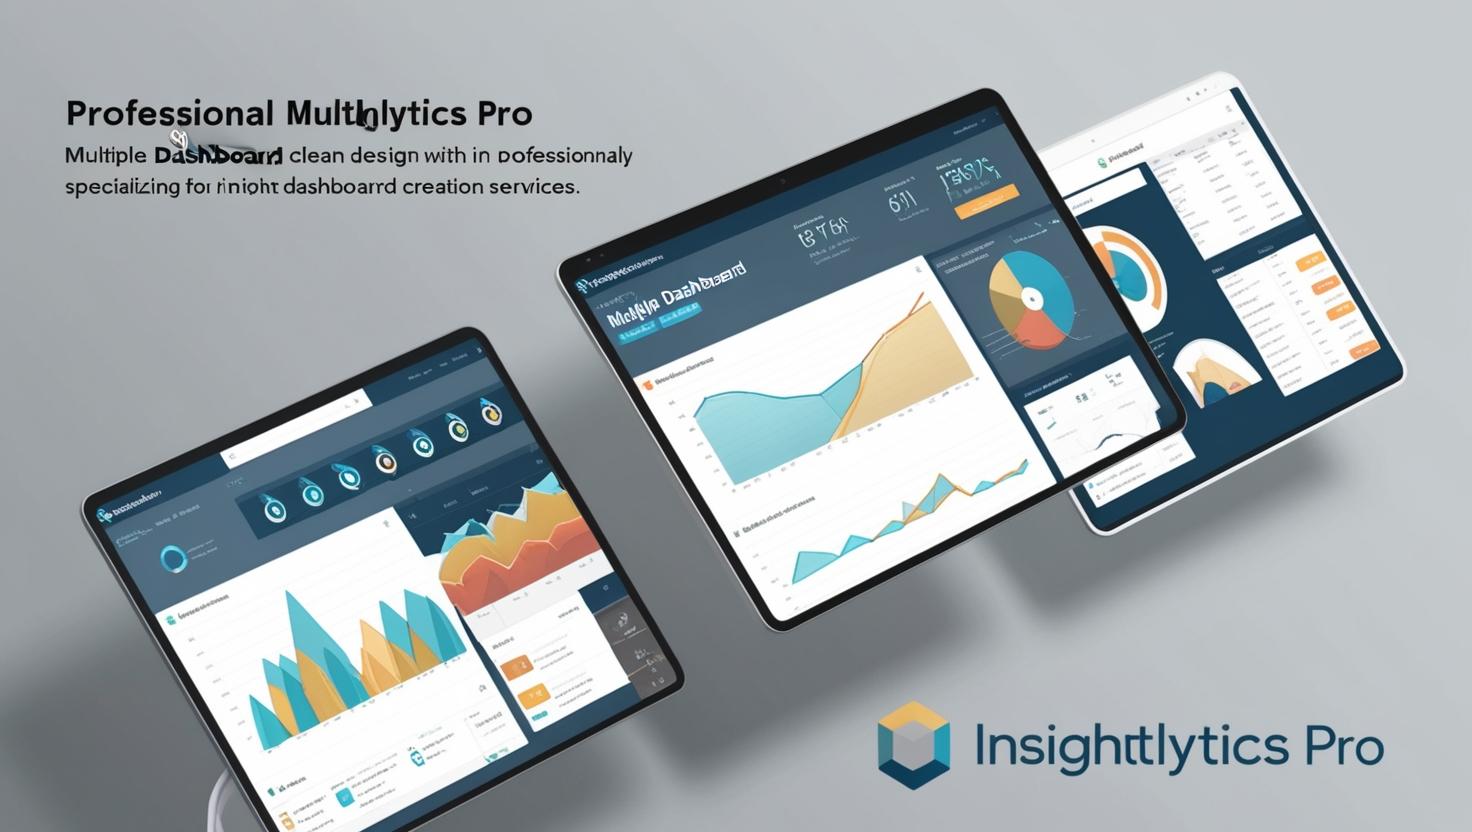
Real-Time Data Analytics
Interactive Analytics Dashboard
Transform your business data into actionable insights with our AI-powered interactive dashboards.
Monitor key metrics, track performance, and make data-driven decisions in real-time.
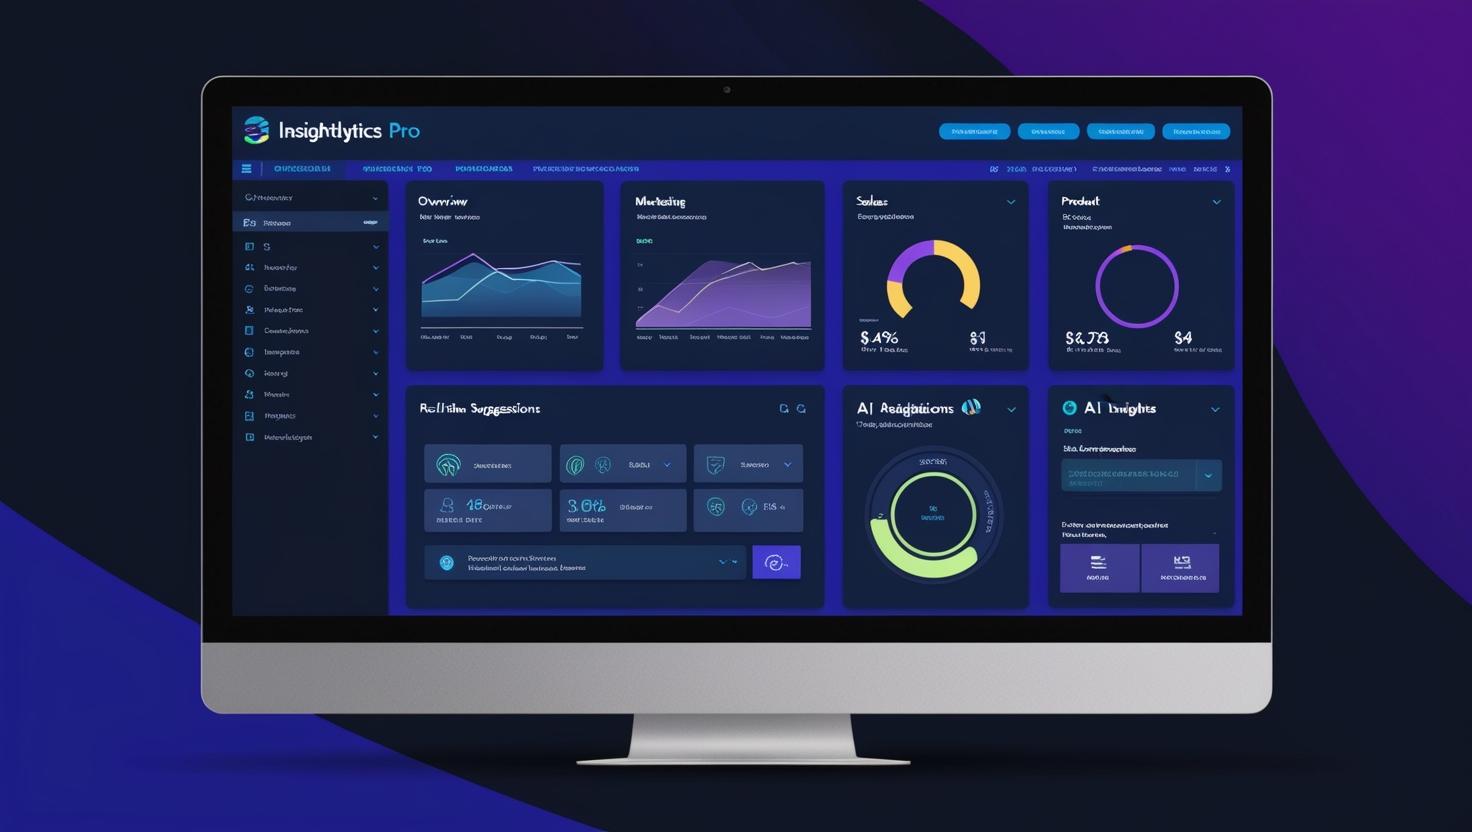


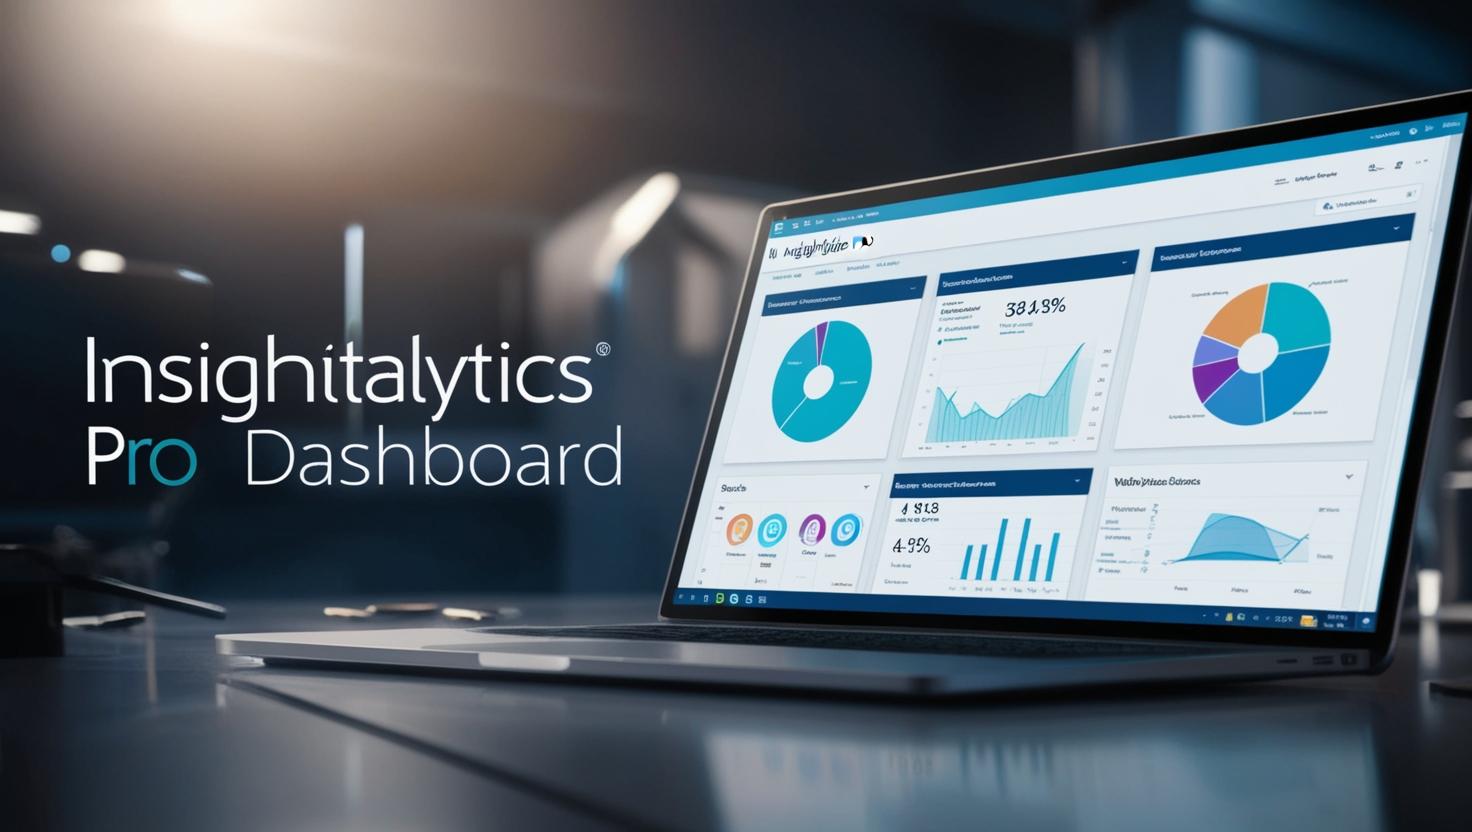


AI-Powered Analytics Features
Our dashboards leverage cutting-edge AI technology to deliver predictive insights,
automatic data processing, and intelligent recommendations.
Predictive Analytics
Leverage machine learning algorithms to forecast trends, predict outcomes, and identify potential opportunities or risks before they occur.
Automated Insights
Automatically detect anomalies, trends, and patterns in your data, providing actionable insights without manual analysis.
Smart Recommendations
Receive intelligent suggestions for optimizing business operations, marketing campaigns, and resource allocation based on AI analysis.
Ready to Transform Your Data Analytics?
Contact us today to discuss how our AI-powered dashboards can help your business
make better data-driven decisions.
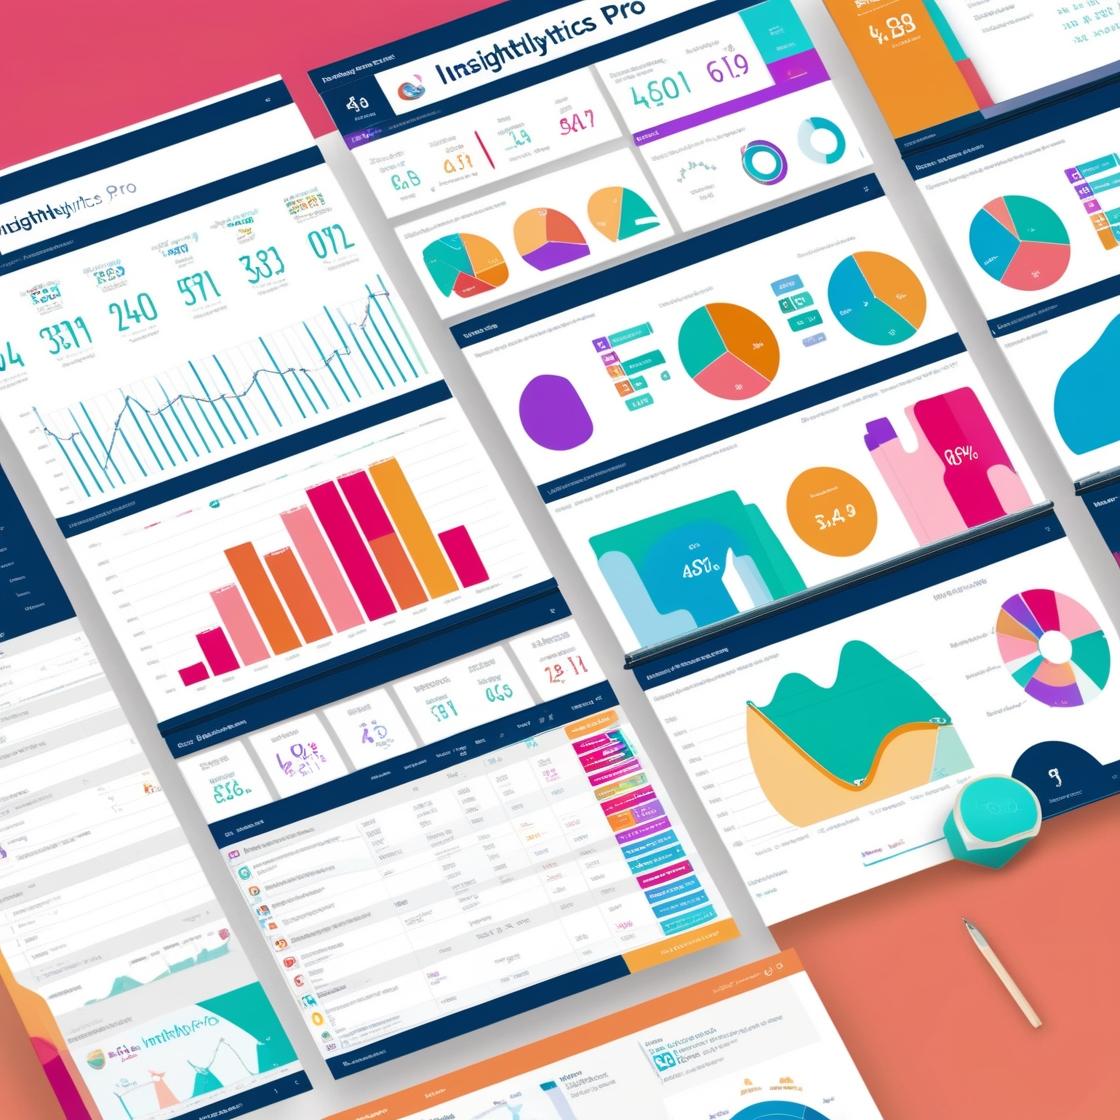
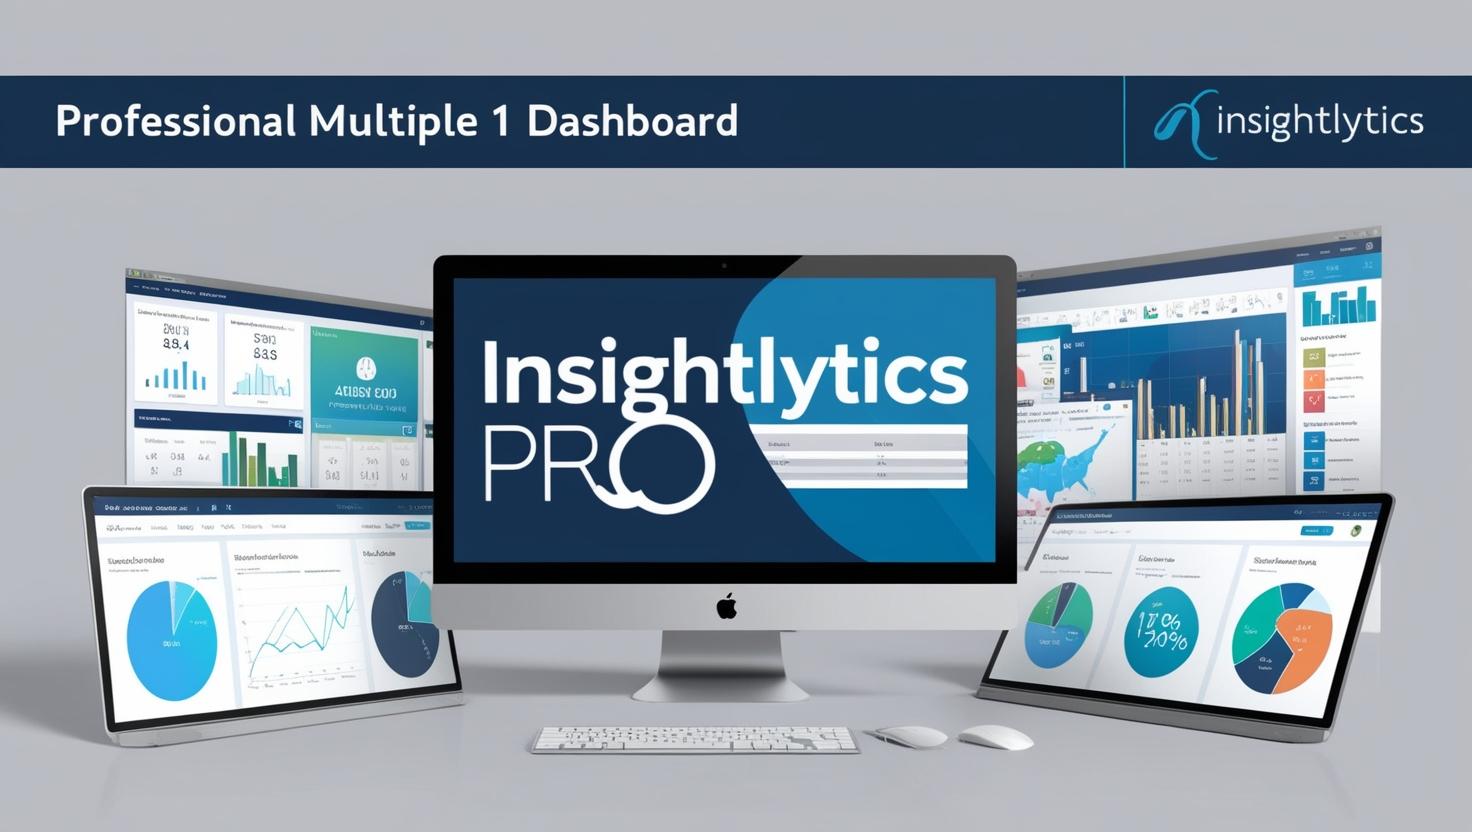
Dashboard Types We Deliver
In a world full of noise, beautifully visualized data creates impact and drives action. Our
precision-crafted dashboards take viewers on a journey, transforming complex data into clear
visual narratives that tell your brand’s story in an authentic and unique way.
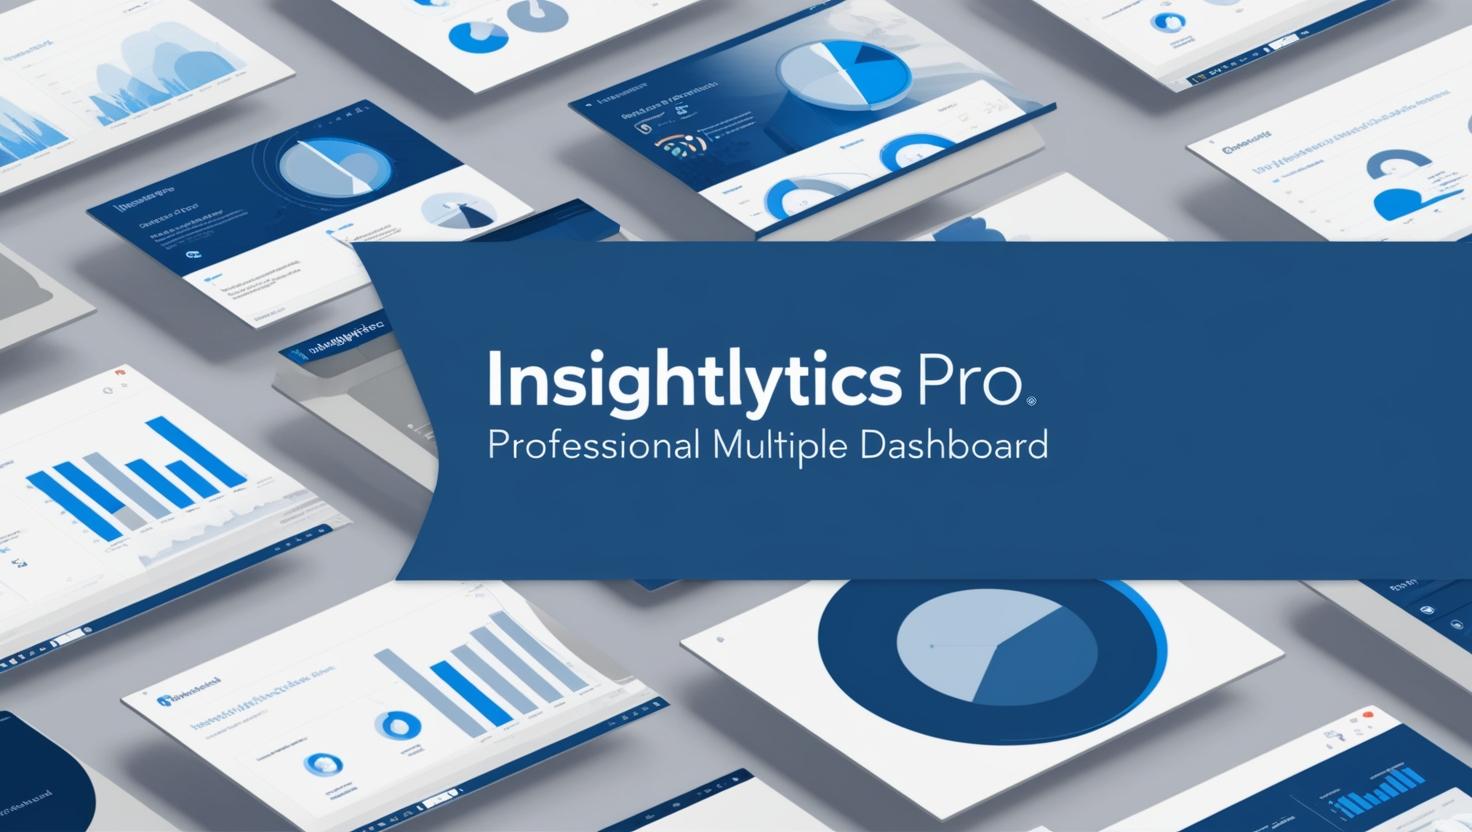
Meet Our Dashboards
Our dashboards are meticulously designed by data visualization experts who blend analytical precision with artistic presentation. Each dashboard is defined by factual accuracy, devised with an artistic eye for visual clarity, and driven by innovative approaches to data storytelling. They represent the perfect marriage of form and function, seamlessly combining beautiful design with analytical rigor to deliver actionable insights that drive tangible business outcomes across every level of your organization.
Self-analysis Portal
The perfect tool for quick and comprehensive data interrogation and exploration. Our self-service analytics portals empower business users to create highly customized tables, charts, and visualizations in seconds using an intuitive drag-and-drop interface. No technical skills required—just your business expertise and questions.
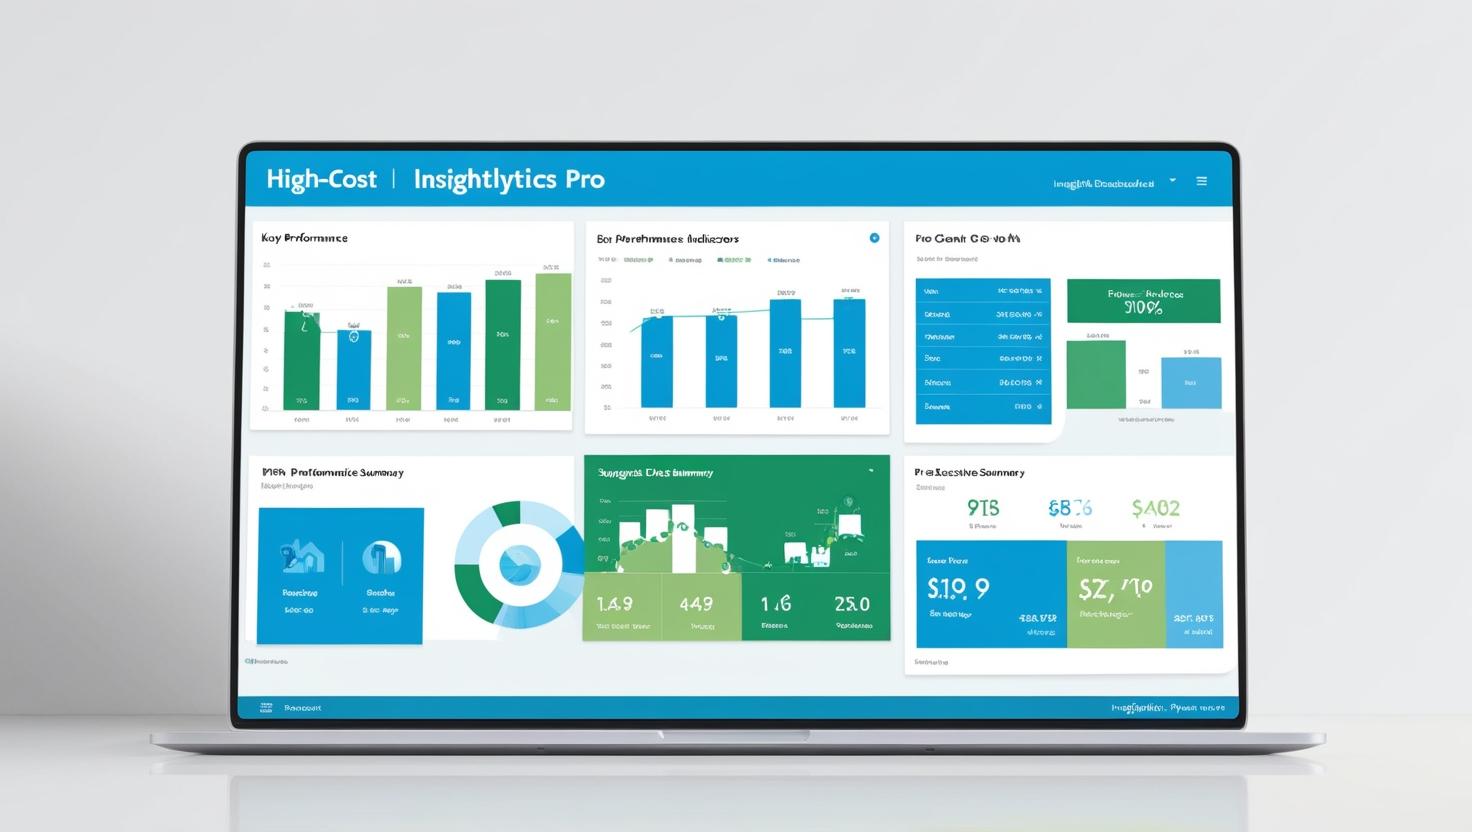
Executive Dashboards
Sophisticated high-level KPI tracking and strategic metrics dashboards specifically designed for C-suite executives and business leaders. These elegant, information-rich displays allow decision-makers to monitor organizational performance at a glance.
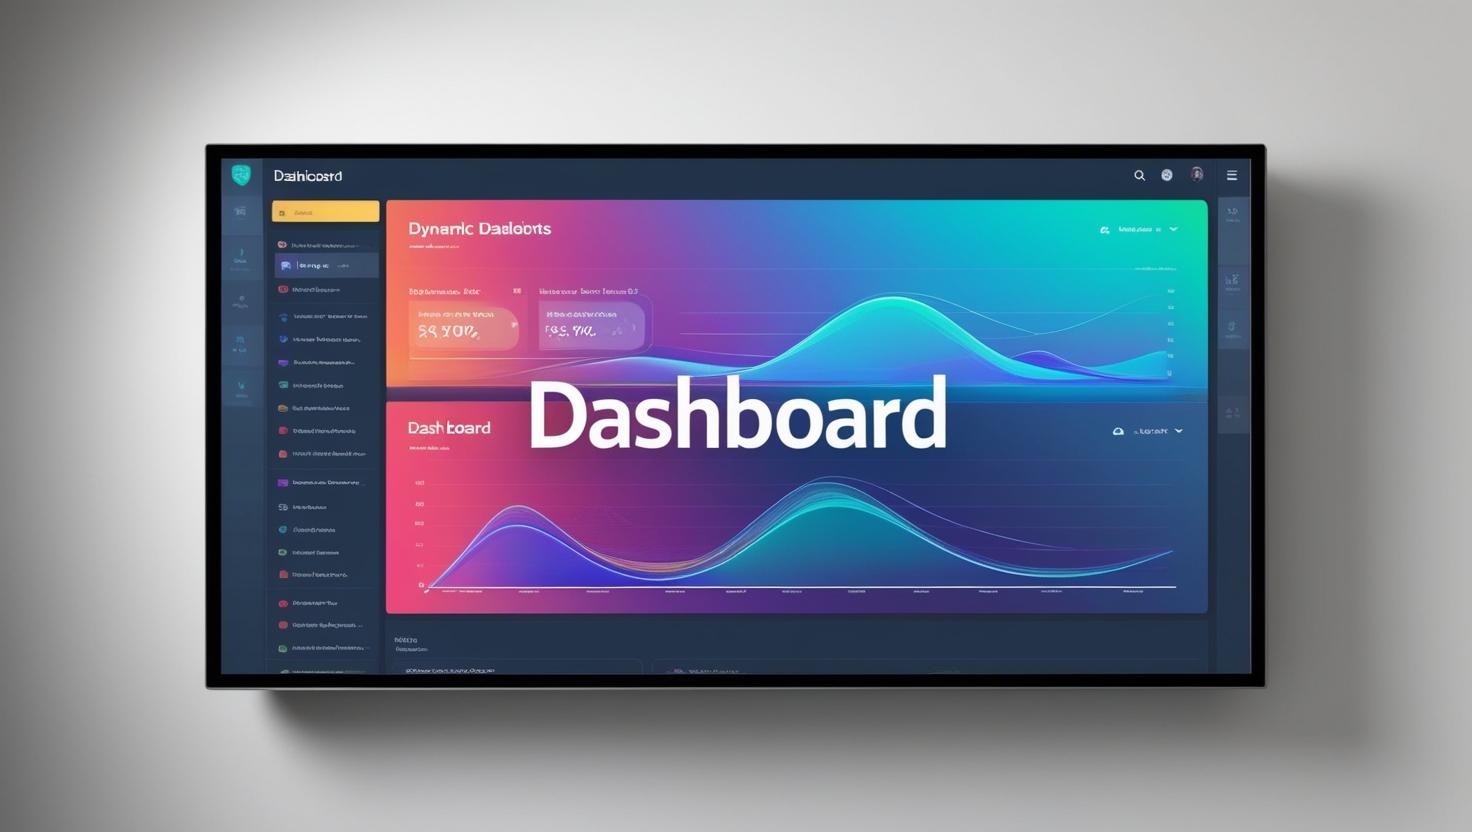
Overview Dashboard
Minimal, summarized, and clarity-first designs that provide high-level executive summaries of key metrics. Perfect for at-a-glance monitoring and high-level strategic decision-making with sophisticated data visualization techniques.
Immersion Dashboard
Transforms data into beautifully compelling stories. It is fully custom-built to your specifications, packages all your brand’s KPIs for clients, and communicates your brand message with engaging visual storytelling techniques.
Exploration Dashboard
Integrates extensive chart designs with helpfully templated displays for a tailor-made finish. All the simplicity of a pre-built dashboard with the uniqueness of your own branding. Ideal for deep data exploration and pattern discovery.
Operational Dashboards
Comprehensive real-time monitoring of business processes and day-to-day operations with actionable alerts and detailed drill-downs. These dynamic dashboards provide frontline managers with immediate visibility into performance metrics and resource utilization.
Download Our Dashboard Catalogues
Our dashboard solutions help you get the answers you need to make better business decisions. Visualize your data in a way that makes sense for your specific needs.
Development Process
Our Dashboard Development Process
Why dashboards? Why now? In a world full of noise, beautifully visualized data has impact. Our dashboards take viewers on a journey and tell your brand’s story.
Fully Branded
Our dashboard solutions are always built to meet your expectations. Fully branded, high-quality designs fully integrated into your company style.
Secure
Every dashboard includes a fully secure user-based, password-protected system with multiple levels of accessibility.
Interactive
Slice and dice up data with interactive filters or enhance outputs with real-time charts that can be generated and exported with click and hover functions.
1
Project Assessment
Estimated time: 1 day
2
Design + Development
Estimated time: 2-3 weeks
3
Integration + Testing
Estimated time: 2-3 days
4
Deploy + Support
Estimated time: up to 1 week
Dashboard Tools We Work With
Ready to Transform Your Data Analytics?
Our dashboards are defined by fact, devised by artists, and driven by innovation. They tell your brand’s story in an authentic and entirely unique way.
1000+ DASHBOARD TEMPLATES
Ready-to-Use Dashboard Templates
Browse our extensive library of 1000+ industry-specific dashboard templates designed for Power BI, Tableau,
Looker Studio, Excel and more. Each template is fully customizable to meet your specific
business requirements and drive better decision-making.
Need a custom dashboard solution?
Can’t find what you’re looking for? Our team can build a custom dashboard tailored to your specific business requirements.
Free Resources
Office Productivity Tools
Access our powerful productivity tools completely free of charge. Enhance your workflow
with AI-powered assistance for spreadsheets, documents, and email management.
Formula Finder
Quickly find the right formulas for Excel, Google Sheets, and other spreadsheet tools. Save time with instant formula suggestions tailored to your data needs.
Function Assistant
Get step-by-step guidance on using complex formulas in your spreadsheets. Master advanced functions with clear, easy-to-follow instructions.
Document Solutions
Troubleshoot formatting, functions, and automation issues in MS Word and Google Docs. Resolve document problems quickly and efficiently.
Email Support
Get tips and automation assistance for managing emails in Outlook and Gmail. Streamline your communication workflow with smart email solutions.
Real-Time Assistance
Integrates extensive chart designs with helpfully templated displays for a tailor-made finish. All the simplicity of a pre-built dashboard with the uniqueness of your own branding. Ideal for deep data exploration and pattern discovery.
User-Friendly Interface
Simple search function for fast problem-solving. Find solutions to your office productivity challenges with a clean, intuitive interface.
Free Access for Everyone
Our Office Productivity Tools are available to all website visitors without any subscription or payment required. Start enhancing your workflow today!
OUR PROCESS
Client Workflow
Our streamlined 5-step process ensures a smooth journey from initial inquiry to active dashboard insights.
Each step is carefully designed to maximize value and minimize time-to-insight.
1
Inquiry & Subscription Selection
Clients explore available plans and sign up for their preferred subscription tier.
2
Onboarding & Customization
Setup and customize dashboards according to the selected plan.
3
Connect to CRM, ERP, APIs, and other data sources.
Setup and customize dashboards according to the selected plan.
4
Dashboard Activation & Insights
Generate reports, analytics, and get valuable business insights.
5
Ongoing Support & Add-Ons
Access ongoing support and explore additional features.
GROWTH STRATEGY
Marketing & Client Acquisition
Our multi-channel marketing approach focuses on providing value upfront, demonstrating our platform
capabilities, and building long-term relationships.
Freemium Model
Offer Free Basic Version for 7 Days
Lead Generation
LinkedIn Outreach, SEO Blogs, YouTube Tutorials
Upselling & Add-Ons
AI Insights, Custom API, Additional User Access
Client Engagement
Demo Calls & Webinars to Convert Leads
Try our platform for free!
Get a 7-day free trial of our Basic plan with no credit card required. Experience the power of Insightlytics Pro firsthand.
Flexible Pricing Options
Subscription Plans
We offer flexible subscription plans tailored for various business needs and company sizes,
from custom dashboard development to comprehensive analytics solutions.
Filter by Company Size
Graph & Chart Types by Plan
Basic
Bar Charts, Line Graphs, Pie Charts
Standard
Funnel Charts, Heat Maps, Comparative Analysis
Premium
AI-Based Trend Analysis, Predictive Models, Waterfall Charts
Enterprise
Fully Customizable Interactive Dashboards, Sankey Diagrams, Cohort Analysis
Basic
Essential dashboards with basic KPIs for small businesses just starting with data analytics.
₹10,000 / month
WHAT’S INCLUDED
NOT INCLUDED
PRO
Essential dashboards with basic KPIs for small businesses just starting with data analytics.
₹25,000 / month
WHAT’S INCLUDED
NOT INCLUDED
Premium
Essential dashboards with basic KPIs for small businesses just starting with data analytics.
₹50,000 / month
WHAT’S INCLUDED
Custom
Essential dashboards with basic KPIs for small businesses just starting with data analytics.
₹65,000 / month
WHAT’S INCLUDED
Enterprise
Essential dashboards with basic KPIs for small businesses just starting with data analytics.
₹75,000 / month
WHAT’S INCLUDED
Try our platform for free!
Get a 7-day free trial of our Basic plan with no credit card required. Experience the power of Insightlytics Pro firsthand.
Business
Vivamus dolor sit amet do, consectetur adipiscing.
Online Store
Sollicitudin ipsum sit amet elit do sed eiusmod tempor.
Personal Blog
Faucibus dolor sit amet do, consectetur adipiscing.
Portfolio
Interdum dolor sit amet elit do sed eiusmod tempor.